U-values, and what they leave out
The number on the specification sheet describes one square metre of an idealised wall in hypothetical equilibrium. The building it goes into is none of those things.
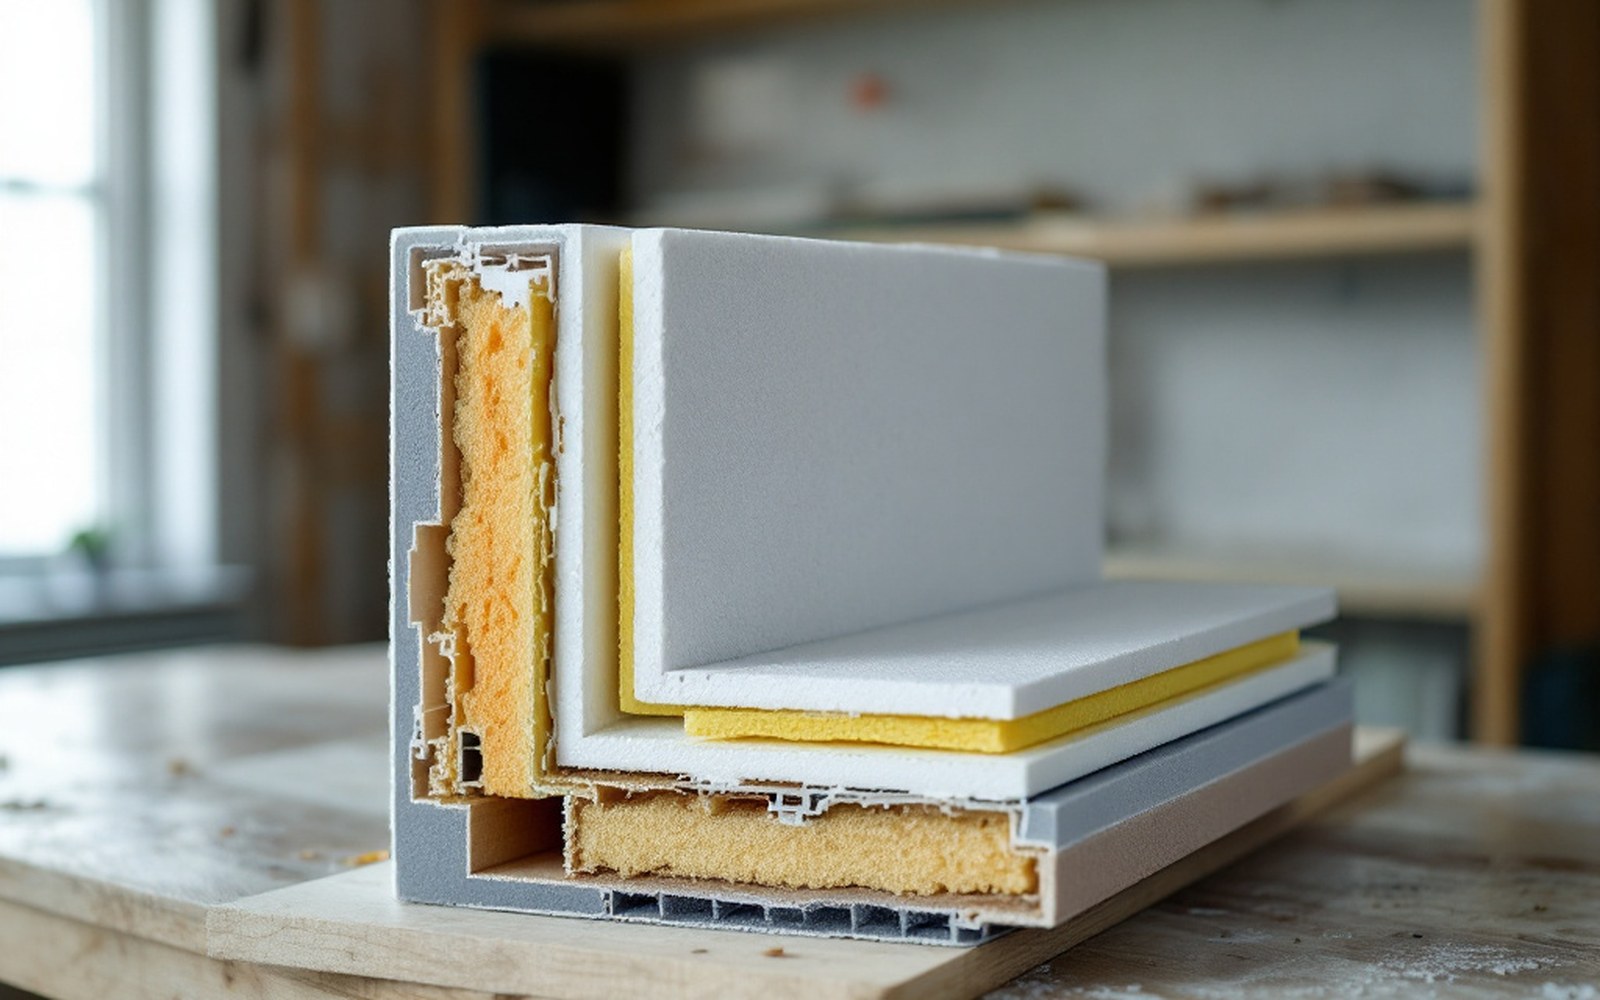 PLATE 01
A build-up cut and mounted: every layer contributes a thermal resistance, and the U-value is what they add up to.
What the U-value actually measures
A U-value — formally, thermal transmittance — is a rate: the watts transferred through one square metre of a construction element for every degree Kelvin of temperature difference between the air on either side. Lower is better; a well-insulated modern wall might reach 0.15 W/m²K, while an uninsulated solid brick wall sits closer to 2.0 W/m²K. The metric has genuine precision within its defined scope, and that scope is narrower than most people assume.
The calculation assumes steady-state conditions: a fixed temperature on each face, no moisture movement, no solar gain, no thermal mass effect, no wind. It also assumes the element is homogeneous, or at least that any repeating structure — a timber stud, a block mortar joint — can be averaged out across the plane. The resulting number is not a fiction, but it describes a controlled laboratory abstraction rather than a wall standing in rain-lashed January weather with a boiler cycling on and off behind it.
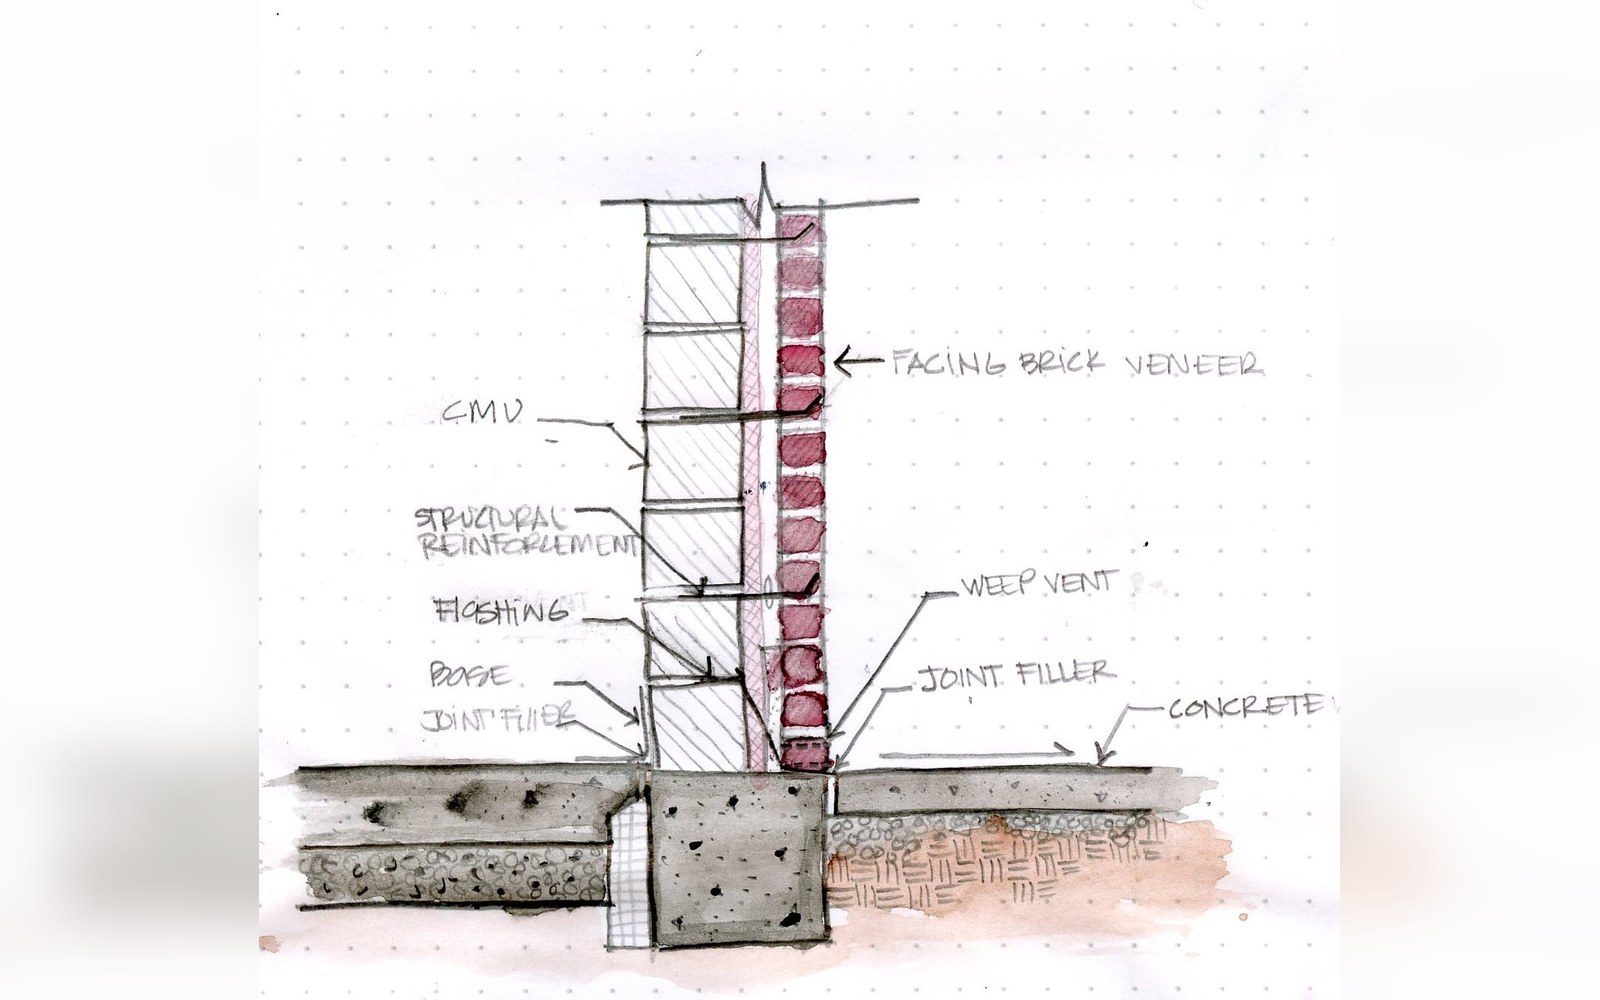 PLATE 02
A cavity opened up. What the plane of the wall does is settled here, and it outweighs the glazing by a wide margin.
Photo: Cavity Wall · Wikimedia Commons
The standards that govern U-value calculation, principally ISO 6946, are transparent about this. The method handles flat, layered constructions; it handles repeating thermal bridges through a correction factor; it does not handle the geometry of junctions, penetrations or projections. Those require a separate accounting, and it is precisely there that design performance begins to diverge from calculated performance.
The things a U-value ignores
Thermal bridges. Every junction — where a wall meets a floor, a roof, a balcony, a window frame — interrupts the insulation plane in a way that is geometrically three-dimensional. Heat does not travel in a straight line at a corner; it fans out through the denser material. A linear thermal bridge is characterised by its Ψ-value (psi-value), which adds watts per metre of junction length per degree of temperature difference. A point thermal bridge — a fixing bolt, a structural tie through a panel — carries a χ-value (chi-value) quoted per item. Neither appears in a U-value. A building designed to a respectable elemental U-value can still lose a disproportionate share of its heat through the junctions if they are not separately modelled, and those losses are accounted for in the y-value: the heat transfer coefficient attributed to all the thermal bridges combined, expressed per square metre of total exposed area. The relationship between a building's elemental U-values and its y-value is the hidden variable in most energy calculations.

A junction detail on the table. A Ψ-value belongs to a specific drawing, and is modelled rather than looked up.
Air leakage. A U-value assumes that the construction is airtight — or rather, it simply has nothing to say about whether it is. A wall with excellent calculated transmittance but a gap at the head of the insulation or a service penetration through the vapour control layer loses heat by a mechanism the U-value is constitutionally unable to capture. Blower-door testing reveals what the specification cannot, by pressurising the building envelope to fifty pascals and measuring the air flow required to hold that pressure. The result — air permeability in m³/h·m² — is an entirely separate metric. The two numbers, U-value and air permeability, are not substitutes; they measure different physics.
Moisture and dynamic conditions. Real insulation materials have thermal conductivity values that shift with moisture content. Mineral wool at 1% moisture by volume performs measurably differently from the same product in its dry, tested state. Calculation methods use declared dry-state values with a correction factor for design conditions, but that correction is a fixed offset, not a response to actual conditions. Similarly, the steady-state assumption strips out thermal mass entirely. A heavyweight construction — dense concrete block, brick, rammed earth — slows the passage of heat through the element in a way that can dramatically shift when peak loads arrive, which matters for comfort and for the coincidence between demand and supply. Thermal mass does not improve a U-value, but it affects the building's actual energy behaviour.
The two numbers, U-value and air permeability, are not substitutes; they measure different physics.
Workmanship and installation. A U-value is a property of the specification, not the as-built construction. Insulation compressed in a rafter bay, a partial-fill cavity with mortar bridging the gap, or a roll of mineral wool that has slipped over fifteen years has a higher effective thermal conductivity than the specification assumed. The performance gap — the documented divergence between modelled and measured energy use — is partly attributable to these installation failures, though occupant behaviour and modelling assumptions contribute independently. Evidence collected across large monitored samples has consistently found measured heat loss higher than predicted, with fabric performance a significant contributor.
What a more complete picture requires
Filling in what U-values leave out is not a matter of finding a better U-value; it requires a separate measurement for each of the missing mechanisms. Linear thermal bridges are quantified through numerical modelling — junction geometries fed into software that solves the two- or three-dimensional heat flow — or looked up in validated libraries such as those published by the Passivhaus Institut ↗ in Darmstadt. Air leakage is measured, not calculated: the blower-door test provides the only number that reflects what was actually built rather than what was drawn. Thermal mass is accounted for through dynamic simulation rather than steady-state U-value arithmetic.
The building regulations and energy rating frameworks used across much of Europe address some of this through the y-value and through standardised allowances for linear thermal bridges; SAP in England, for instance, applies a default y-value of 0.15 W/m²K to account for junctions when a detailed calculation is not submitted. That default is a conservative estimate intended to discourage ignoring junctions entirely, not an accurate description of any particular building. A building whose junctions have been carefully designed and numerically verified will carry a lower y-value; one where the detailing has received little attention may carry a higher one, and the difference runs directly through the calculated energy demand.
The U-value is not wrong. It is the right answer to a specific and limited question: how much heat flows through one square metre of this element under steady-state conditions? The discipline of building fabric performance begins by knowing that question and knowing its limits — that the element sits within a building with junctions, gaps, fixings and real weather, none of which the transmittance calculation sees. Ranking the various heat-loss mechanisms before deciding where attention is warranted is the whole of the analytical task, and the order of magnitude of each mechanism is what makes that ranking possible.
Read next