Cold bridges the camera finds first
Cold bridges the camera finds first
A thermal camera at dusk shows lintels, balconies and wall plates as bright lines — because heat is going round the insulation rather than through it.
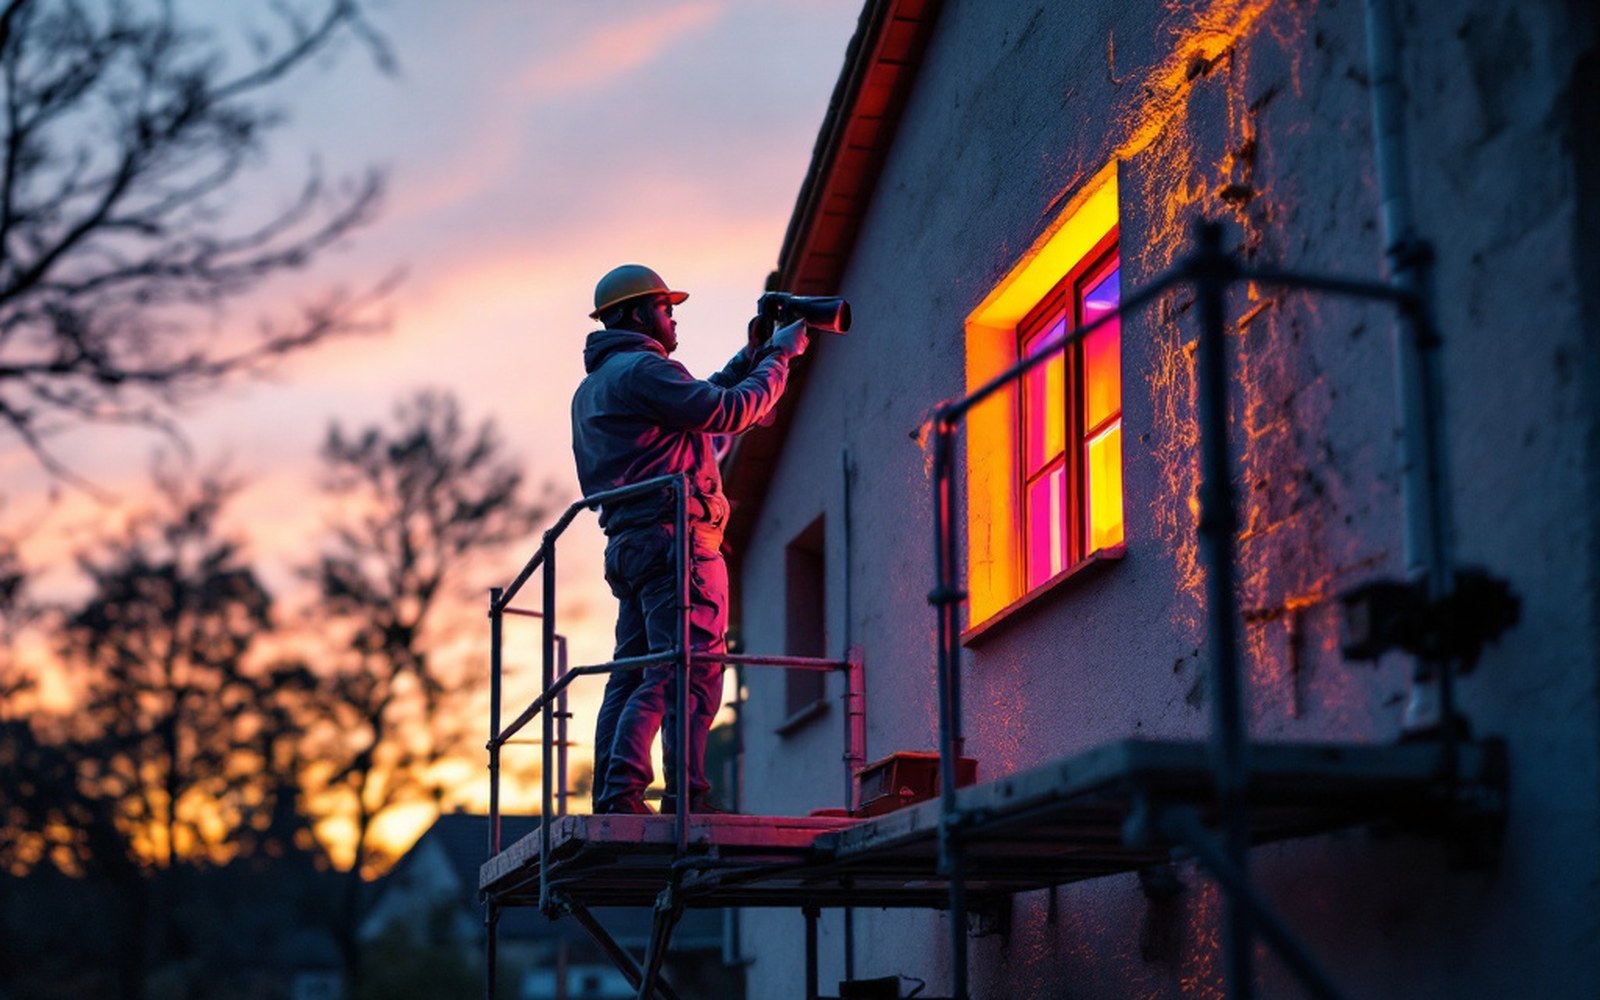 PLATE 01
Thermography works in the hour after sunset, once solar gain on the surface has dissipated and the fabric is still warm.
What the camera is actually seeing
An infrared camera does not measure cold. It measures the radiant temperature of a surface, and the image it produces is a map of surface temperature variation across whatever it is pointed at. When a surveyor aims one at a house façade in the hour after sunset — when solar heating of the surface has dissipated but the fabric is still warm from the day — the brightest patches in the image are the warmest external surfaces. Warmth on the outside means heat has arrived there from inside. The insulation has been bypassed.
The lines that appear first, and brightest, are almost always the same ones: the steel lintel above a window opening, the head of a cavity closer, the edge of a concrete floor slab where it projects as a balcony, the timber wall plate bedded into the inner leaf at eaves level. These are thermal bridges — junctions and repeating elements where geometry, material change or structural continuity creates a path of lower resistance than the surrounding insulated field. Heat is not clever; it goes where it can, and a steel lintel embedded in a masonry wall offers conductivity well over a thousand times greater than the mineral wool it interrupts.
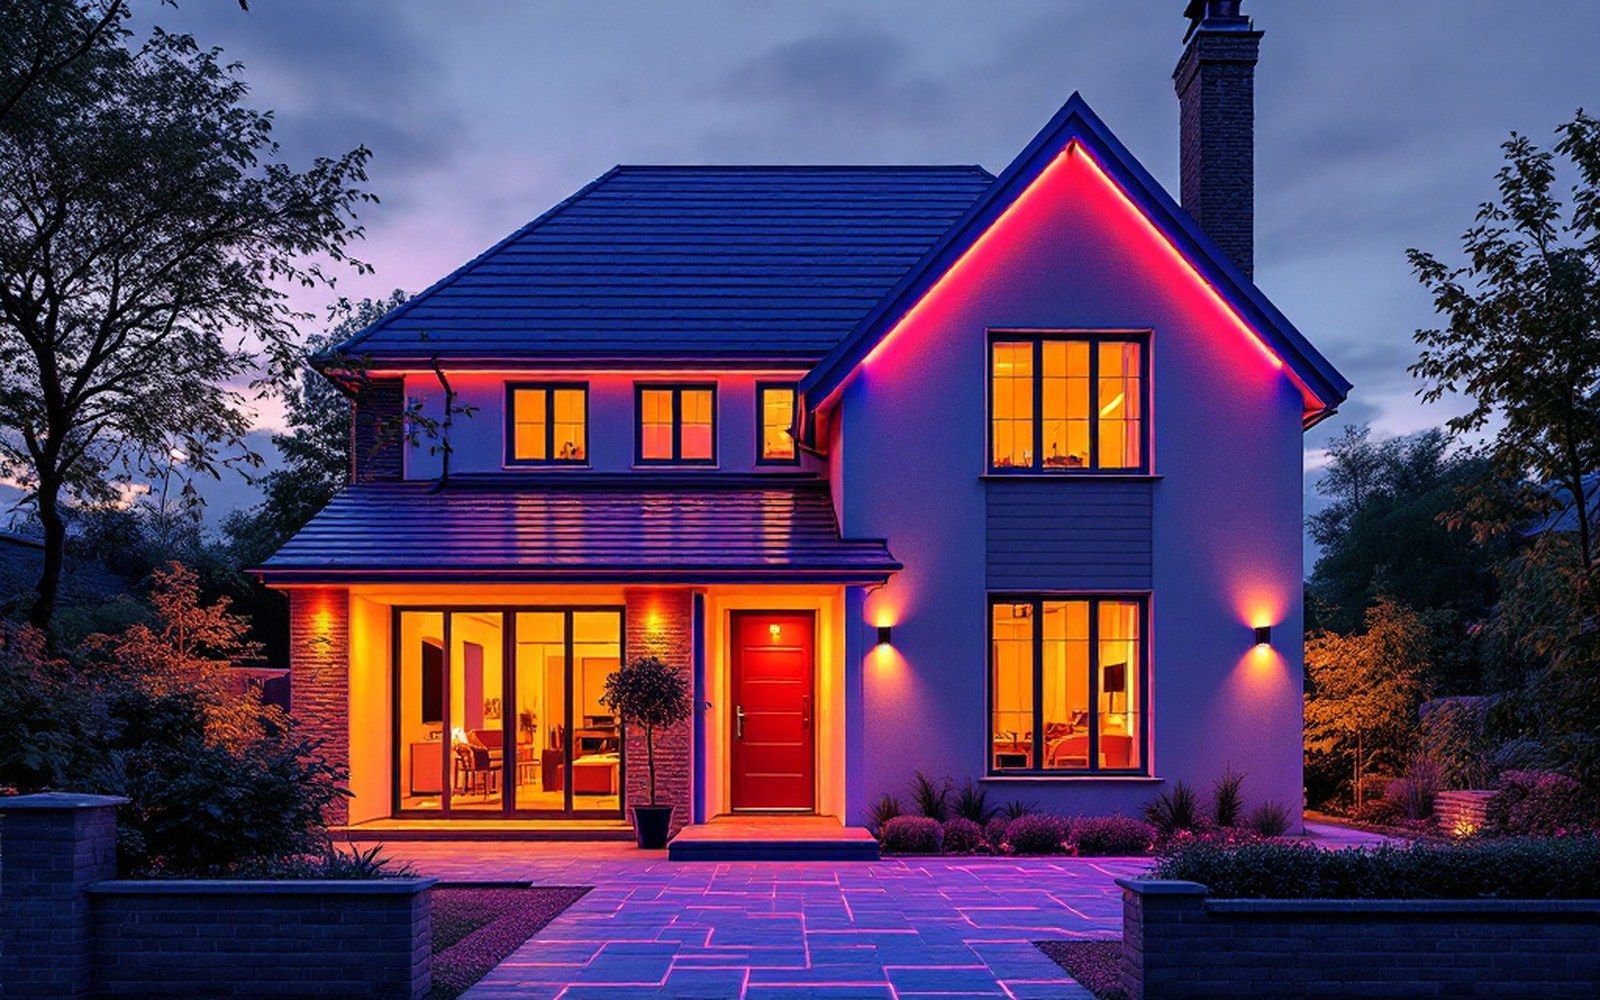 PLATE 02
Warmth reaching the outside face of the building: the eaves line, the window heads and the reveals are all brighter than the wall they sit in.
The formal measure is the Ψ-value (psi-value), linear thermal transmittance, expressed in watts per metre per kelvin: the heat flow rate per unit length of junction per degree of temperature difference. A well-designed eaves junction in a new build might carry a Ψ-value around 0.04 W/mK; a poorly detailed one can reach 0.3 W/mK or beyond. The camera renders that difference as a brightness gradient — a tutorial in what the model either assumed or ignored.
Why these junctions, specifically
Lintels deserve attention first because they are so numerous and so often underestimated. A typical two-storey house may have ten or more window and door openings. Each one has a lintel. The older the building, the more likely that lintel is a single steel angle sitting inside the cavity, conducting heat directly from the warm inner leaf to the cold outer one. A thermographic survey of pre-2000 cavity-wall housing in the UK consistently shows these as the dominant visible bridges — bright horizontals across the top of every opening, sometimes accompanied by a faint warm glow at the sill where a similar issue operates in reverse.
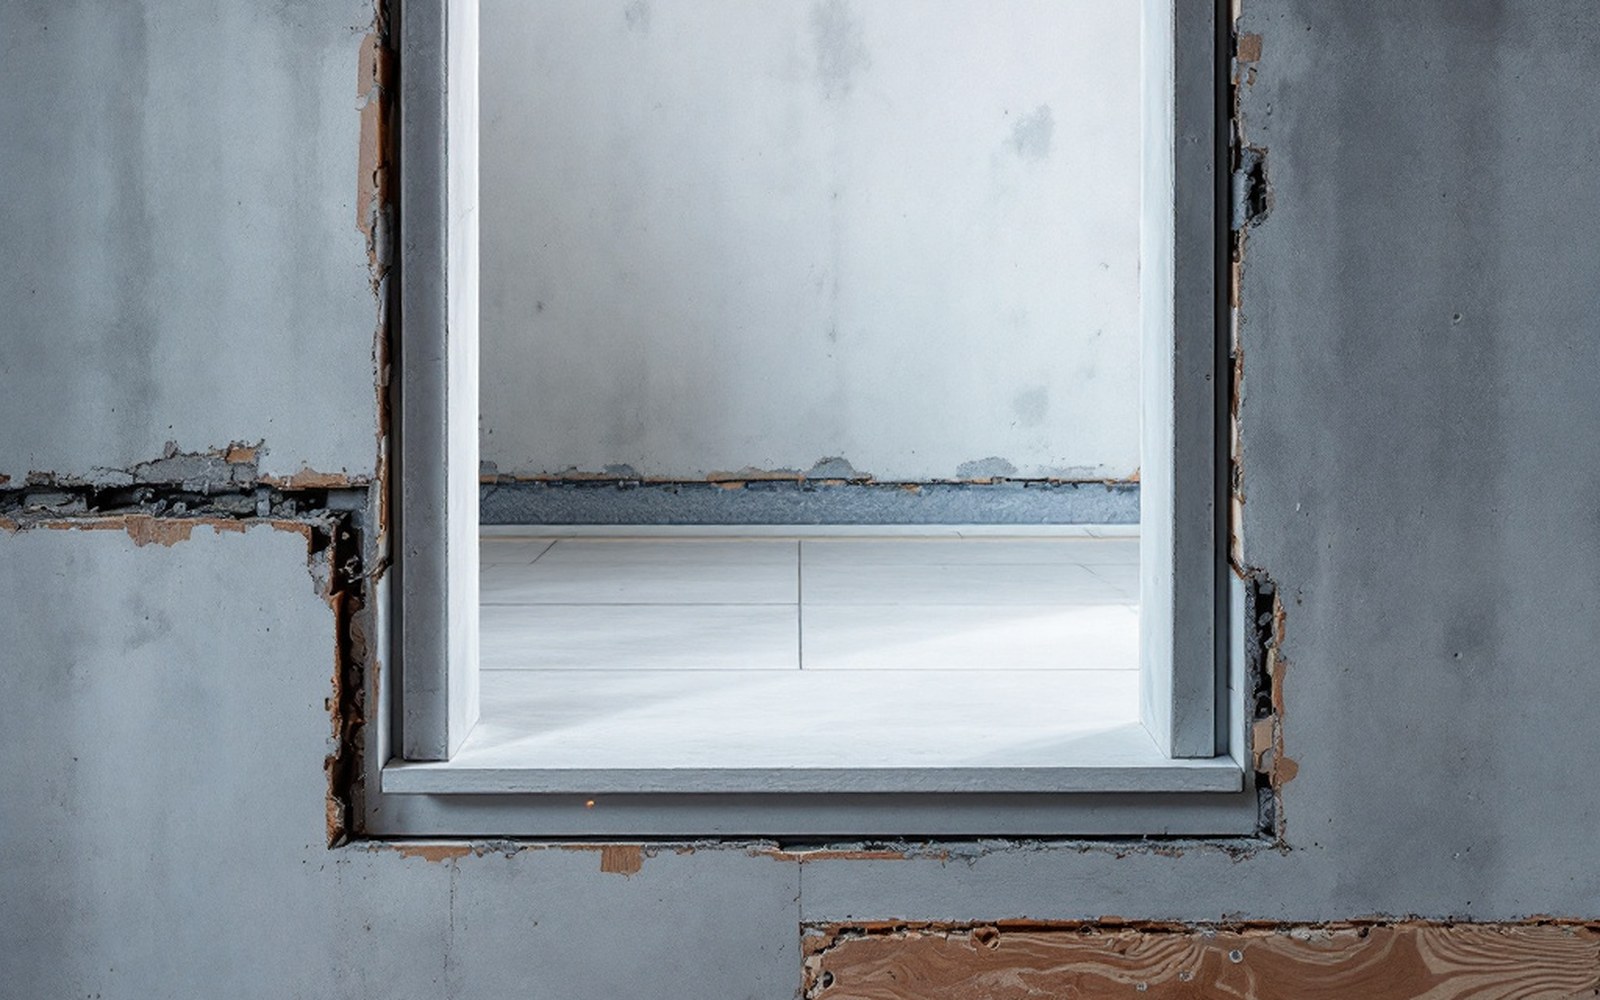
A slab passing through the plane of the insulation, exposed on three sides once it is outside.
The balcony is a different geometry but the same physics. A cantilevered reinforced concrete slab is a continuous structural element punching through the plane of the insulation. Its large surface area, exposed on three sides to the outside, and its high thermal mass mean it draws heat out of the building persistently and returns condensation risk to the soffit of the slab inside. EN ISO 10211, the standard governing three-dimensional thermal bridge calculation, was substantially developed with junctions like this in mind, because one-dimensional U-value analysis cannot capture them.
Wall plates are less visible to the non-specialist eye in a thermal image but they appear reliably in a professional survey: a warm band running horizontally across the top of the wall just below the eaves, tracing the timber bearing on the inner leaf. Timber is not a good insulator in the context of a wall built to modern standards — its conductivity is roughly 0.13 W/mK, a poor performer compared with 0.030–0.040 W/mK for mineral wool — and where it is embedded in masonry without a thermal break, it creates a repeating bridge that runs the full perimeter of the building.
A cantilevered reinforced concrete slab is a continuous structural element punching through the plane of the insulation.
The cumulative effect matters. A study by Leeds Beckett University's Centre for the Built Environment tracking monitored housing found that thermal bridging accounted for between 20 and 30 percent of the total fabric heat loss in dwellings that had been insulated to then-current standards, with the lintel and ground-floor perimeter junctions contributing the largest individual shares. A building that looks well-insulated in a flat-element U-value assessment can carry a y-value — the total thermal bridge allowance expressed as an additional U-value increment across the whole floor area — that effectively degrades every U-value in the calculation.
What the camera cannot tell you, and what the numbers require
Thermography is evidence, not measurement. An image showing a bright lintel tells a surveyor where the bridge is and roughly how severe it appears relative to surrounding elements; it cannot, on its own, produce a Ψ-value. For that, you need either a finite-element calculation using software such as THERM or HEAT2 — modelling the actual cross-section geometry and material conductivities — or a measured heat flux, which requires contact sensors and controlled conditions that a dusk survey does not provide.
The Passivhaus Institut ↗ in Darmstadt, whose airtightness and thermal performance requirements are defined by measured outcomes rather than prescriptive specifications, sets a maximum Ψ-value at each junction to control this precisely because they understood early that aggregate bridge losses overwhelm the gains from high-specification insulated fields if junctions are not designed explicitly. Their certified thermal bridge library documents calculated Ψ-values for standard junction types so that designers can assign values with confidence rather than rely on the global default figures that national calculation methods often permit.
National calculation methods — SAP in England and Wales, SBEM for non-domestic buildings — allow a default y-value of 0.15 W/m²K where thermal bridges have not been assessed junction by junction. That default represents a moderately bridged building, but it also means that a designer who has invested in thicker insulation may be using a y-value that does not reflect their actual detailing. The camera, when it finds the bright lines at dusk, is auditing exactly this gap.
There is a complementary test that thermal imaging cannot replace: an air-tightness test measures convective heat loss through gaps and cracks, while the camera maps conductive short-circuits through solid material. Both matter; they compound; and a building that passes one diagnostic in isolation may still fail the other in ways that the headline U-value never suggested. Taken together, thermographic survey at the appropriate conditions and a blower-door test under 50 pascals describe the fabric more fully than any desk calculation, however carefully assembled.
The camera at dusk is a reminder that thermal performance is not an average. A wall with a centre-of-panel U-value of 0.18 W/m²K has a number that applies to the quiet middle of the element, the square metres where nothing structural happens. At every edge — at the lintel, the eaves, the slab edge, the window reveal — the number changes, and in buildings that were not detailed to manage it, the change is always in the same direction. The bright lines in the image are heat that has found the path of least resistance. The design either accounted for it or it did not, and the camera simply confirms which.
Read next