What the model said, what the meter said
What the model said, what the meter said
Design-stage predictions and measured energy use diverge by a factor that has been confirmed across thousands of dwellings — the gap is structural, not exceptional.
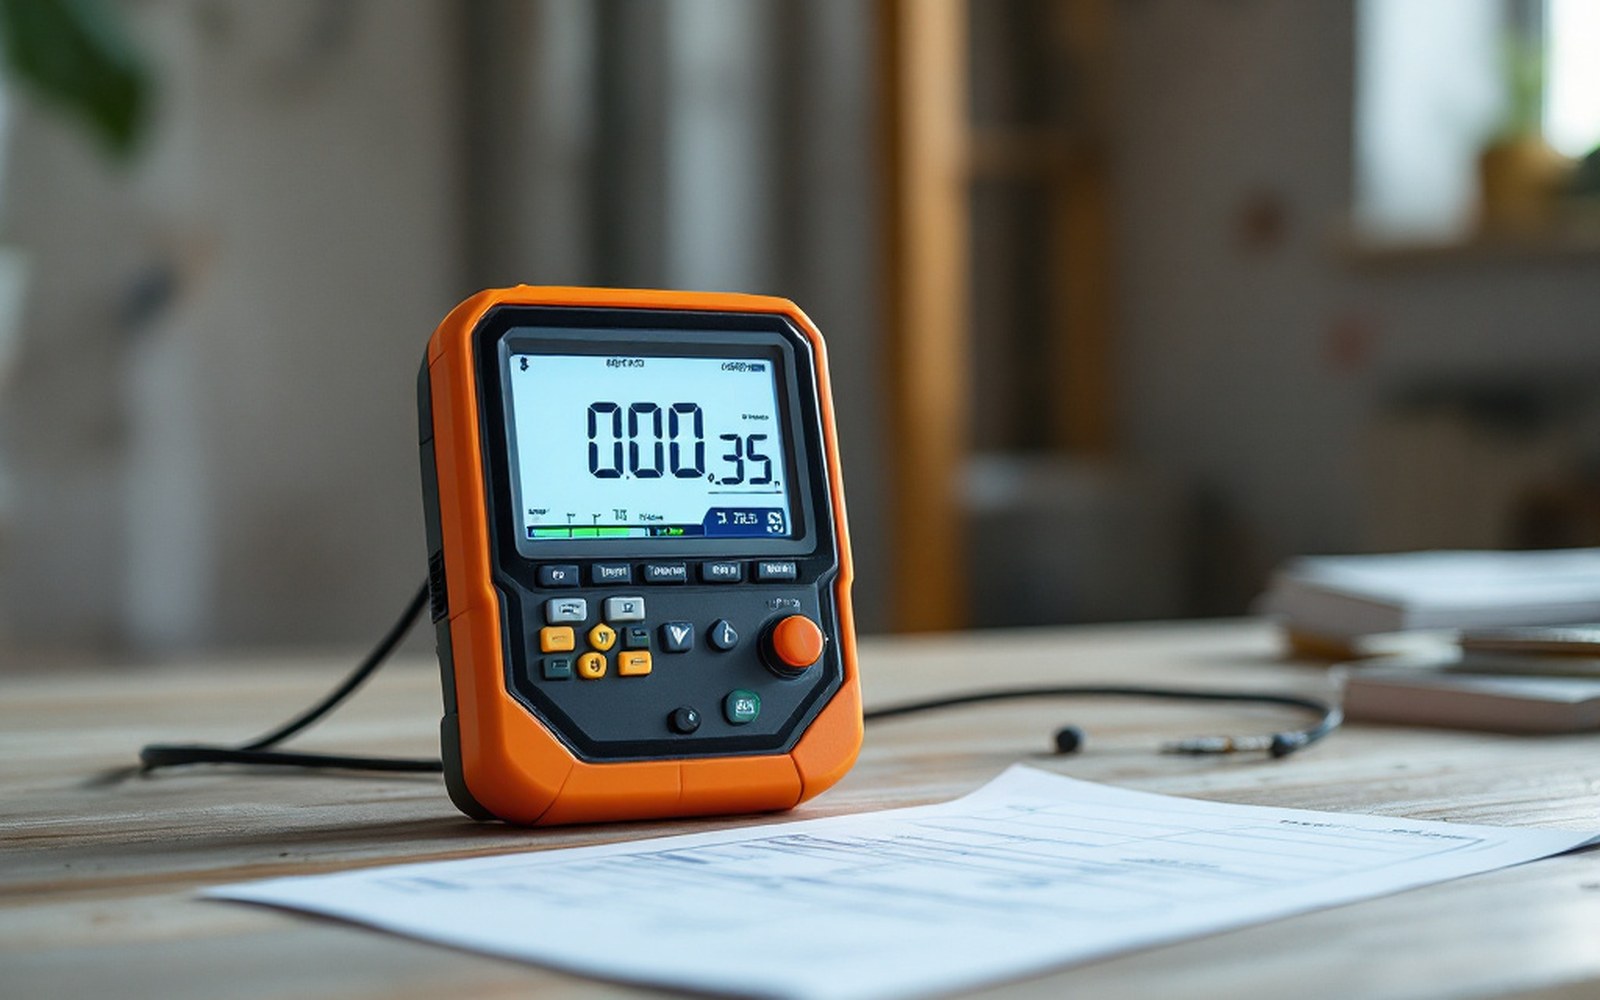 PLATE 01
A meter and a modelled output on the same table — the two figures the performance gap is the distance between.
Why the gap exists at all
A building energy model is a set of assumptions dressed as arithmetic. Feed it a floor area, a set of U-values, an air permeability target, and a standard occupancy profile, and it will return a space-heating demand figure that looks precise to the decimal place. The precision is real; the accuracy is another matter. The model is predicting what the building would use if it were built exactly as drawn, occupied by a notional household following notional behaviour, in a year of average climate. None of those conditions hold simultaneously in practice, and often none of them holds at all.
The UK's Zero Carbon Hub published findings in 2014 drawing on monitored data from several hundred new-build dwellings. The headline was that measured energy use for space heating ran substantially higher than the Standard Assessment Procedure predicted — in many cases by a factor of between 1.5 and 2.5. That range has since been reproduced, with different samples and different methods, in studies from Leeds, from Loughborough, and by the Energy Performance of Buildings Directive review bodies in Brussels. The Zero Carbon Hub's 2014 report on the performance gap is among the most-cited pieces of primary evidence in UK building science, precisely because its sample was large enough to rule out the explanation that outliers were skewing the result.
 PLATE 02
Survey figures before any intervention is chosen. The ranking is the analysis, not a preliminary to it.
The gap is not random noise. It skews consistently in one direction: buildings use more than the model says they will, not less. That directionality is itself informative. If the gap were random — sometimes too high, sometimes too low — the correct conclusion would be that individual households are unpredictable. But a systematic upward bias means the model is missing something real and recurrent, and identifying what that is turns out to be the more useful project.
What the measurements reveal
Monitored studies separate the gap's causes into three rough categories: modelling assumptions, construction quality, and occupant behaviour. In practice these interact, but they can be weighted.

Warmth reaching the outside face of the building: the eaves line, the window heads and the reveals are all brighter than the wall they sit in.
Modelling assumptions account for a substantial share. Standard Assessment Procedure, the UK's regulatory compliance tool, uses a fixed internal temperature of 18 °C, averaged across the dwelling and the heating season. Real households often heat their living spaces to 20–21 °C, sometimes higher, and the relationship between internal temperature and heat loss is not forgiving: every additional degree held against an outdoor temperature of, say, 4 °C increases the driving force for conduction and thermal bridging proportionally. The model also assumes a fixed heating schedule, a fixed hot-water demand, and standardised appliance gains. Real occupancy is messier.
Construction quality is the second major contributor, and the harder one to excuse. Thermal bridges at junctions — lintels, wall-plate connections, where a floor slab meets an external wall — are sometimes accounted for in the model using default psi-values (Ψ-values) derived from standard junction details. When those junctions are built differently from the detail, or when the detail was never chosen with heat loss in mind, the actual linear thermal transmittance can be considerably higher than the assumed figure. Similarly, air permeability targets are routinely set at 5 m³/(h·m²) at 50 Pa in UK building regulations, but the blower-door test that would reveal whether that target was met often happens after the building is occupied, or not at all on smaller projects. Leeds Beckett University's monitoring of its own low-energy teaching building found air infiltration substantially higher than modelled, a finding that translated directly into measured heating demand exceeding prediction.
Construction quality is the second major contributor, and the harder one to excuse.
The third strand is behaviour, which is real but tends to be overstated as an excuse for poor construction. Occupant behaviour varies the distribution of energy use around whatever the building's physical fabric permits. A very leaky, poorly bridged building will use a lot whether its occupants are frugal or profligate; a very tight, well-detailed building will use relatively little under the same range of behaviour. The fabric sets the floor and ceiling; behaviour moves the result within that range. Attributing the performance gap primarily to occupants is, the monitored evidence suggests, the wrong reading of the data.
The measurement tools and their limits
Post-occupancy evaluation of whole-building energy use is relatively straightforward: meter readings against degree-day-normalised predictions. Degree days quantify the accumulated difference between outdoor temperature and a base temperature, allowing heating demand from one winter to be compared meaningfully with another. Without that normalisation, a cold year looks like an inefficient building.
More granular diagnosis requires more instrumented approaches. Heat-flux sensors embedded in a wall element allow a measured U-value to be derived — a figure that frequently differs from the as-designed U-value, not because the insulation product was fraudulent but because the workmanship around it introduced voids, compression, or bridging that the design did not anticipate. Co-heating tests, in which a dwelling is held at a constant elevated temperature for several weeks and the electrical input required to maintain it is measured against the concurrent heat loss through the fabric, give a whole-building heat loss coefficient that can be compared directly against the modelled figure. Studies using co-heating tests on new-build UK dwellings have found measured heat loss coefficients averaging around 70 % higher than design predictions — a figure reproduced in work published by the Energy House facility at Salford and referenced in subsequent BEIS-commissioned research.
The Passivhaus Institut ↗ in Darmstadt requires verification of the design and a measured airtightness test as part of its certification process, which is one reason the Passivhaus standard can point to a tighter correspondence between predicted and measured performance than is typical for buildings certified only under national regulations. The standard's air-tightness limit of 0.6 air changes per hour at 50 Pa is a measured figure, not a design aspiration, and the Passivhaus planning package models thermal bridges explicitly rather than accepting blanket default values.
The performance gap is not a puzzle awaiting solution. Its causes are understood; the data is public. Narrowing it requires measurement at handover, not just at design — which is a procedural demand more than a technical one.
Read next