Cold bridges the camera finds first
Ψ-values and the y-value
The junctions between elements carry heat faster than the elements themselves, and a calculation that ignores them is flattering a building it should be measuring.
 PLATE 01
A junction detail on the table. A Ψ-value belongs to a specific drawing, and is modelled rather than looked up.
What a Ψ-value actually measures
A U-value describes one square metre of an element in steady state — the flat field of a wall, the uninterrupted run of a roof. It says nothing about what happens where that wall meets the floor, where a window frame lands in a reveal, or where a balcony slab punches through the insulation line. Those junctions conduct heat along a path that is neither uniform nor one-dimensional, and a separate quantity is needed to describe them.
That quantity is the Ψ-value (psi-value), the linear thermal transmittance of a junction. Its unit is watts per metre per kelvin — W/m·K — and it expresses the additional heat flow per metre length of a junction, above and beyond what the abutting plane elements already account for. A window-head detail might carry a Ψ-value of 0.04 W/m·K; a poorly detailed ground-floor edge might reach 0.15 W/m·K or more. The number itself is small in isolation, but junctions run for metres, sometimes tens of metres, around a building's perimeter and openings, and their combined contribution accumulates fast.
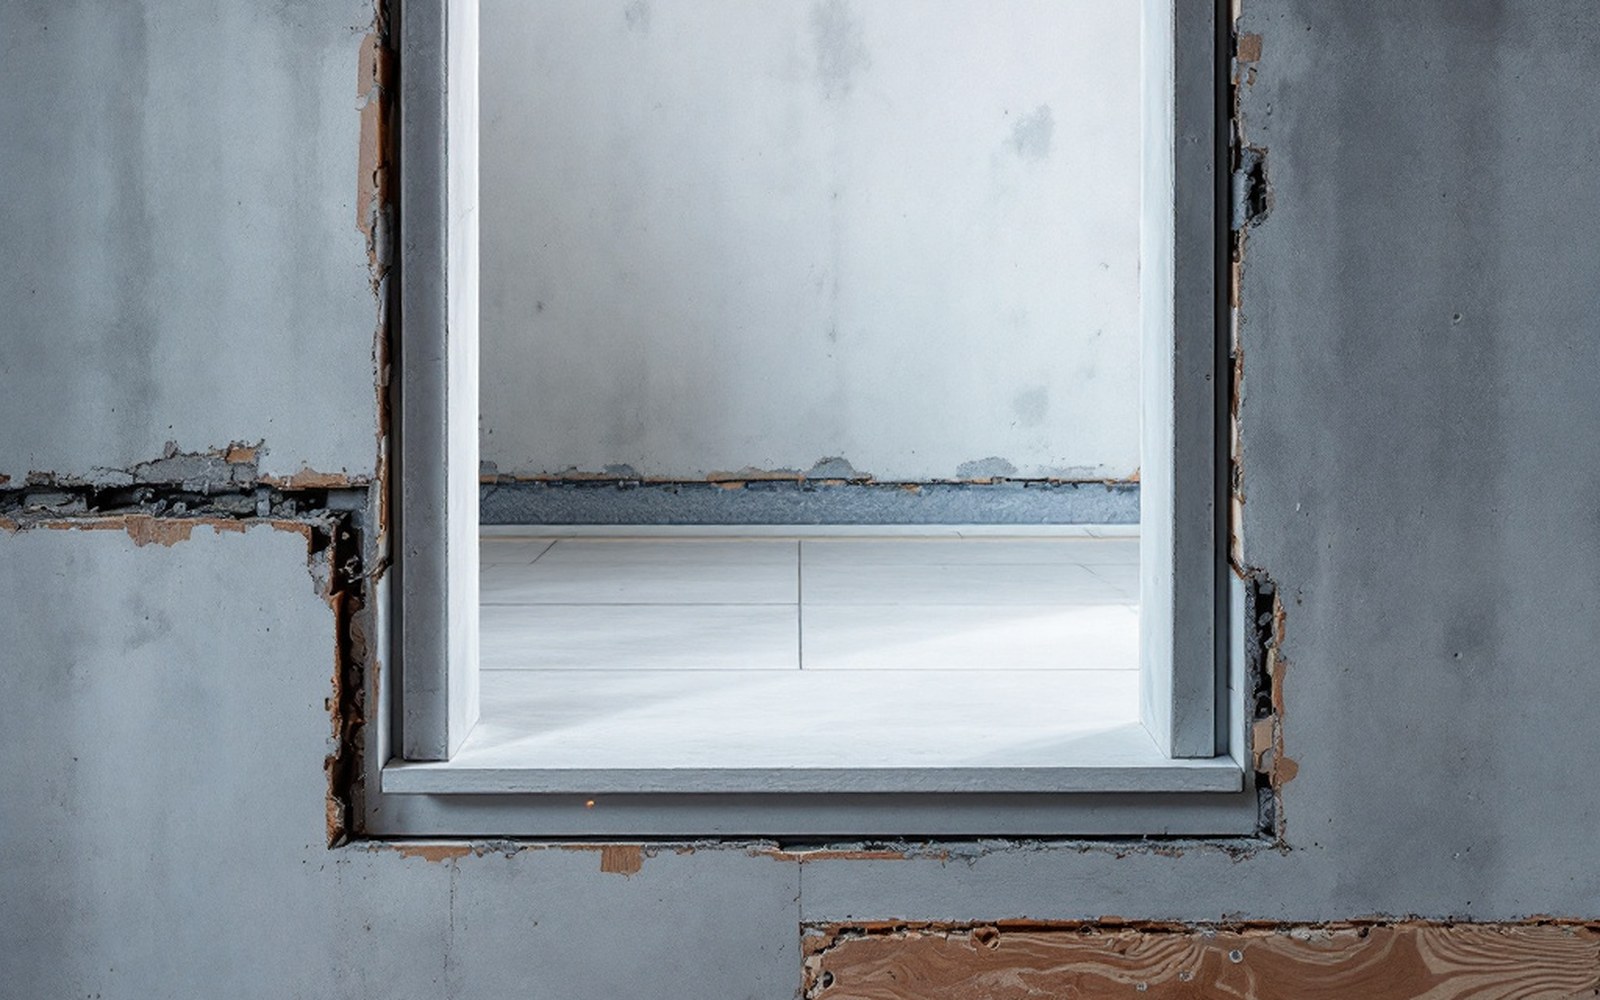 PLATE 02
A slab passing through the plane of the insulation, exposed on three sides once it is outside.
The Ψ-value is calculated, not measured directly. A finite-element model of the junction cross-section solves the heat-flow equations numerically, and the result is the difference between the total conductance through the modelled geometry and the conductance that the plane-element U-values would have predicted. The standard procedure in the UK follows BR 497 and the conventions of BS EN ISO 10211, which sets out how boundary conditions are applied, how the calculation domain is sized, and how the result is extracted. Calculated values for common junctions in the UK are published in the government's Approved Construction Details and in the BRE's own thermal bridge library.
From junction to whole-building: the y-value
Knowing the Ψ-values of individual junctions is the detailed view. A building has dozens of distinct junction types, each running for a different length — the sum of (Ψ × length) over every junction gives the total linear thermal transmittance of the envelope, in watts per kelvin. Divide that by the total exposed surface area of the building, and the result is the y-value: a single number, in W/m²·K, that captures the average additional heat loss per unit area attributable to junctions alone.
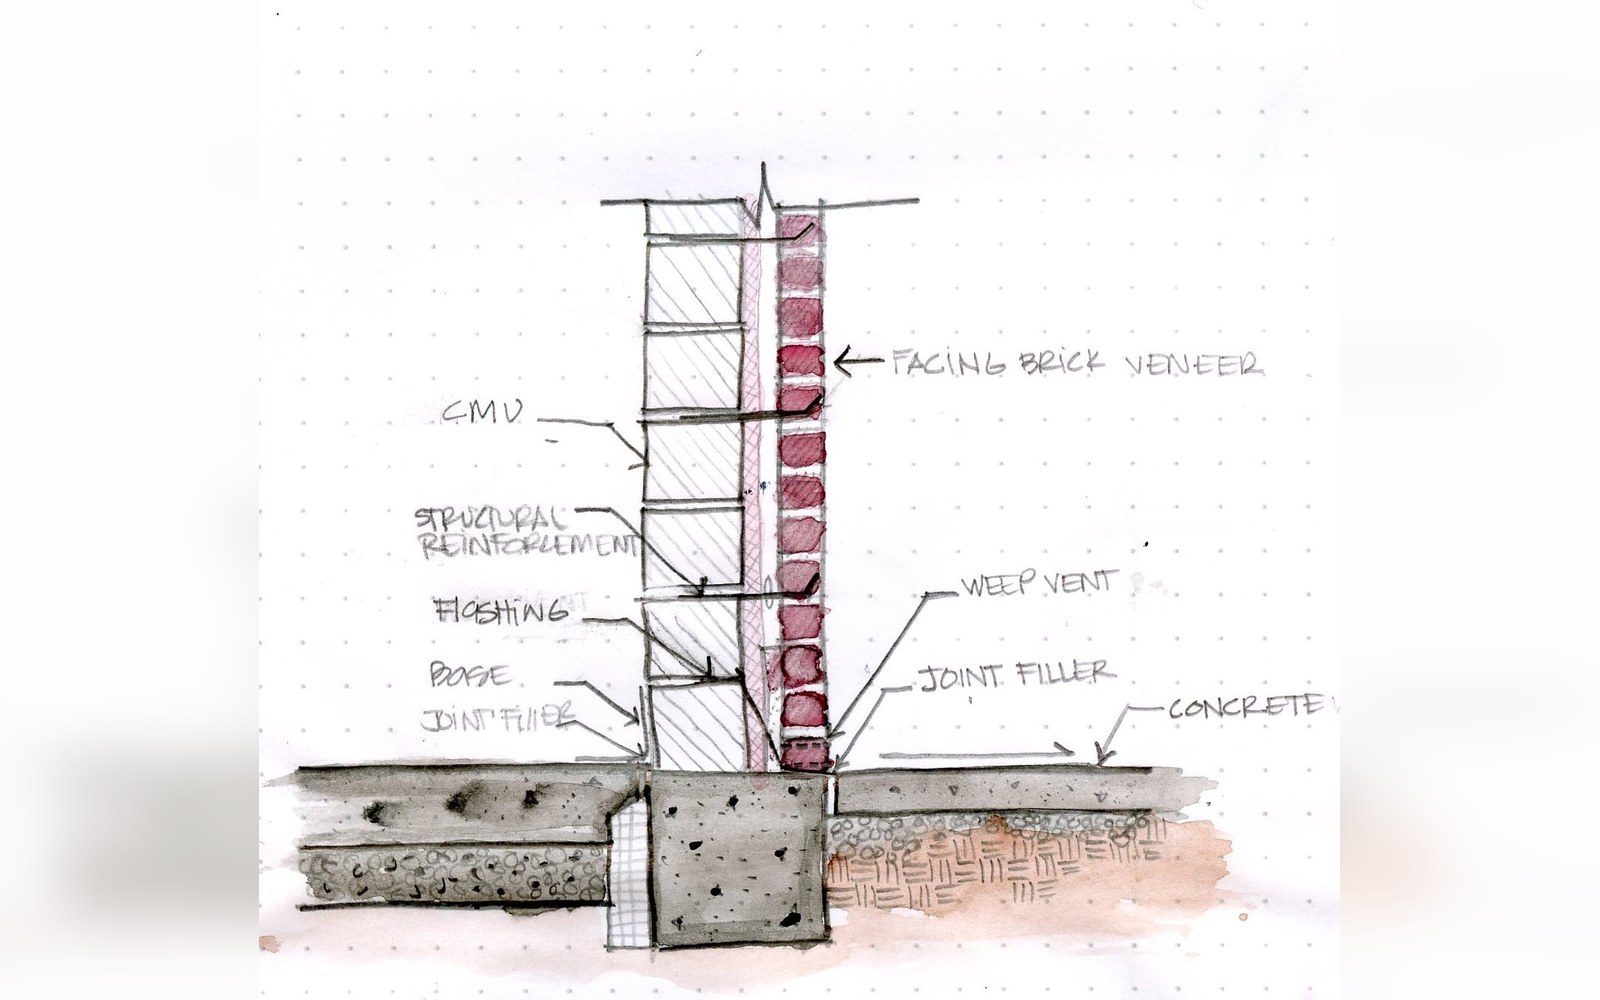
A cavity opened up. What the plane of the wall does is settled here, and it outweighs the glazing by a wide margin.Photo: Cavity Wall · Wikimedia Commons
The y-value appears directly in SAP, the UK's Standard Assessment Procedure for energy rating, as a term added to the average elemental U-value to produce the heat loss parameter. Its influence on the calculation is therefore real and traceable: a building whose y-value is assumed rather than calculated will have that assumption baked into every energy metric that follows. SAP allows three routes. The most accurate is to calculate Ψ-values for every junction from approved software. The intermediate route uses the Approved Construction Details, assigning a default Ψ-value to each junction type if it can be demonstrated that those details were actually built. The least accurate — and most commonly used in practice — is to apply a global default y-value of 0.15 W/m²·K, a figure that was calibrated against typical 1990s construction and sits well above what careful detailing can achieve.
That default is where the flattery enters. A well-detailed new build, with junctions modelled individually and executed to match, might achieve a y-value below 0.08 W/m²·K. A building with the default applied will appear worse on paper than it performs in reality if the construction is better than the assumed 0.15, and better on paper than in reality if it is worse — and in many cases the construction does not match the default, in either direction. Sloppy detailing at junctions can push the real thermal bridge heat loss well above 0.15 W/m²·K even while the paperwork records the default.
A well-detailed new build, with junctions modelled individually and executed to match, might achieve a y-value below 0.08 W/m²·K.
The gap between the calculation and the building
The Passivhaus Institut ↗ in Darmstadt treats thermal bridges with particular rigour: its standard requires that all linear thermal bridges be either eliminated or accounted for explicitly, and it sets a threshold of 0.01 W/m·K for a junction to be considered negligible. That discipline is one reason Passivhaus buildings consistently show small gaps between predicted and measured heat loss — the junctions are not approximated away.
In mainstream construction the picture is different. The performance gap between designed and measured energy use has been documented repeatedly across large UK samples, with measured heat loss running significantly higher than predictions. Junction detailing is one of the documented contributors. A thermal camera deployed at dusk on a newly completed building routinely reveals lintels, wall-plate zones and window reveals that glow against the background wall, indicating surface temperatures depressed by heat flow paths the SAP calculation either defaulted or idealised. The camera does not measure Ψ-values directly, but it identifies which junctions warrant further attention and whether site execution matched the design intent.
The governing geometry matters too, and it is a source of systematic error that is easy to overlook. Ψ-values depend on whether the calculation uses internal, external or overall dimensions — BS EN ISO 10211 and BS EN ISO 10077 for window frames specify the conventions, and mixing dimensional bases between the elemental U-values and the Ψ-values can double-count or omit real heat-flow paths. SAP specifies the use of internal dimensions for floor area but total internal volume, while Passivhaus uses external dimensions throughout; a building assessed under both methods will show different junction lengths for the same physical junctions, because the line assigned to each falls in a different place.
The practical consequence is that Ψ-values and the y-value are not decorative precision — they are the terms in which a significant fraction of a building's envelope heat loss is accounted for or discarded. Studies examining the thermal bridge contribution to total fabric heat loss ↗ in well-insulated buildings consistently find that as elemental U-values fall, the junction fraction rises as a proportion of the total: at high insulation levels, Ψ-values can account for thirty percent or more of the remaining fabric loss. Ignoring them does not make them disappear; it moves them off the calculation and onto the heating bill.
Read next