It was never the windows
An uninsulated wall and a leaky roof line dwarf the glazing question that most conversations start with, and the arithmetic is not close.
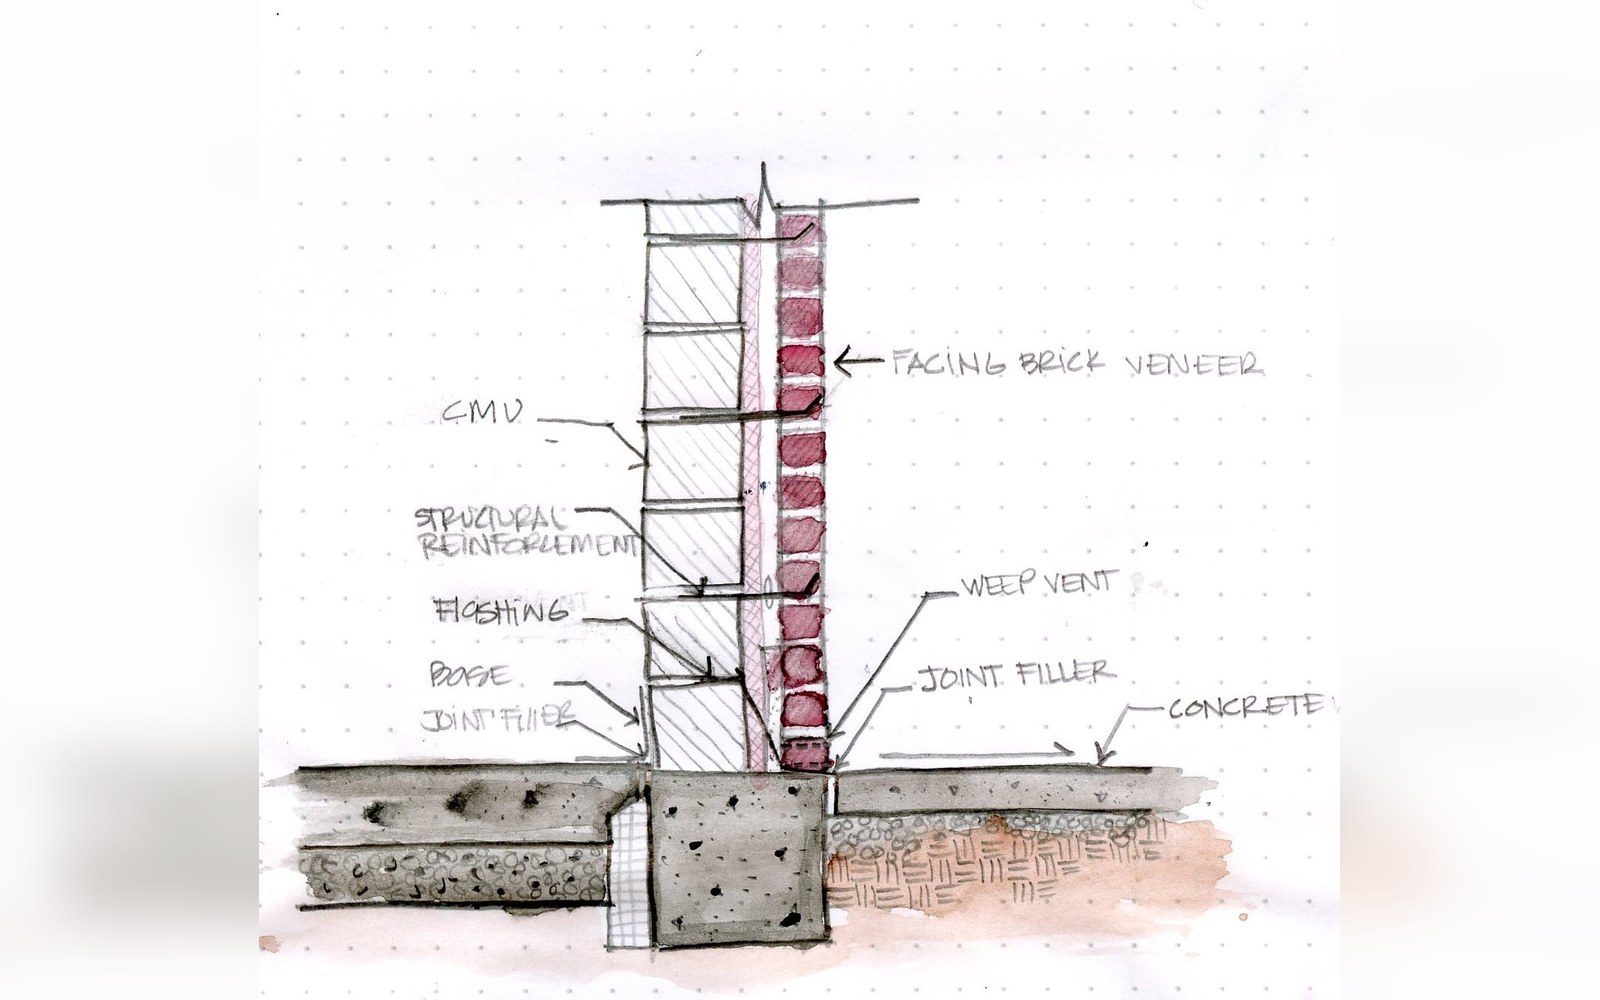 PLATE 01
A cavity opened up. What the plane of the wall does is settled here, and it outweighs the glazing by a wide margin.Photo: Cavity Wall · Wikimedia Commons
Upgrading glazing is among the least efficient uses of an insulation budget — the arithmetic, run correctly, makes that clear
The conversation always starts in the wrong place
Walk into almost any discussion about an under-performing house and the windows come up within the first two minutes. Triple glazing, secondary glazing, warm-edge spacer bars — there is a whole vocabulary ready to be deployed before anyone has looked at the walls. The instinct is not irrational. Windows are visible; they feel cold to the touch in January; the industry that sells replacements has spent decades reinforcing the association between draught and glazing. But the instinct runs ahead of the arithmetic, and the arithmetic is not close.
 PLATE 02
Warmth reaching the outside face of the building: the eaves line, the window heads and the reveals are all brighter than the wall they sit in.
A standard double-glazed unit might carry a U-value somewhere around 1.4 to 1.8 W/m²K. Upgrade it to a high-specification triple-glazed unit and you might reach 0.6 to 0.8 W/m²K — a meaningful reduction in transmittance per square metre. The problem is the square meterage. In a typical mid-terrace house, glazing accounts for perhaps 10 to 15 percent of the total external envelope area. The walls, floor slab, and roof account for the rest. When heat loss is ranked by path — element by element, as the order of magnitude requires — the window question usually lands fourth or fifth, not first.
Where the heat actually leaves
Take an uninsulated solid brick wall, common in housing stock built before the 1920s across most of northern Europe. Its U-value runs between 1.8 and 2.2 W/m²K, and it typically comprises 50 to 60 percent of the external envelope. At those areas and that transmittance, the wall alone may account for more total heat loss than every other element combined. Insulate it — internal dry lining or an external render system (cavity fill only where a cavity exists), depending on construction — and the U-value falls to somewhere in the range of 0.2 to 0.35 W/m²K. The energy arithmetic of that intervention dwarfs anything glazing can contribute.
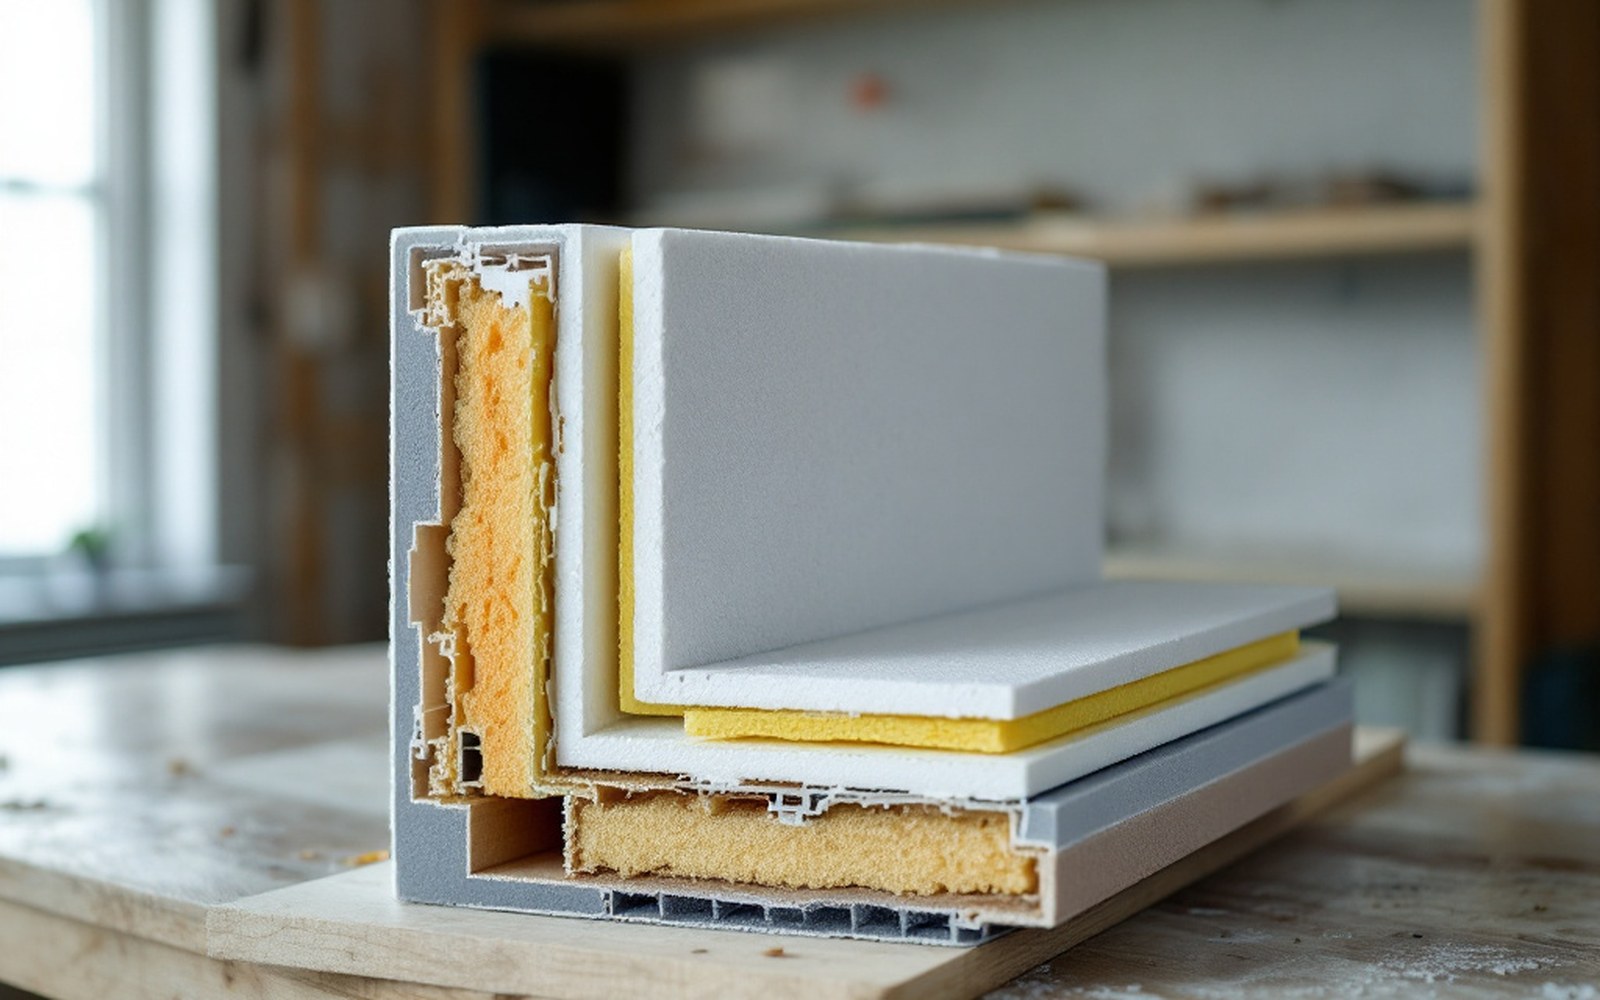
A build-up cut and mounted: every layer contributes a thermal resistance, and the U-value is what they add up to.
The roof is the second structural problem. An uninsulated or under-insulated loft loses heat upward through the largest single horizontal plane of the building, and convection assists it. UK Building Regulations have tightened loft insulation depths over successive revisions, but the existing stock is full of houses with 100mm of mineral wool laid between joists — a specification that dates from the 1980s and delivers a U-value around 0.4 W/m²K, roughly twice the current notional standard of 0.16 W/m²K for new build. Increasing the depth costs very little per square metre of loft floor. The gain per pound of intervention is hard to beat from any other element.
The floor is often neglected entirely. Suspended timber floors over an unheated sub-floor void, and ground-bearing slabs with no perimeter insulation, both leak heat in ways that are difficult to measure without careful analysis. U-values and what they leave out explains why the steady-state calculation tells only part of the story here — edge losses and thermal bridging at the floor perimeter can dominate the actual loss figure in a way the simple U-value does not capture.
An uninsulated or under-insulated loft loses heat upward through the largest single horizontal plane of the building, and convection assists it.
The junction problem compounds the error
Focusing on windows misses a second layer of arithmetic entirely: linear thermal bridges at junctions. Every wall-to-floor junction, every window reveal, every eaves detail carries a Ψ-value (psi-value) — a linear thermal transmittance expressed in W/mK — that adds heat loss proportional to the length of the junction rather than the area of the element. In poorly detailed construction these junction losses can add 15 to 30 percent to the whole-fabric heat loss above what the elemental U-values alone would suggest.
The y-value, which aggregates the junction contribution across the whole building, is routinely omitted from simplified energy assessments. When it is included, the relative importance of fabric elements shifts further. A window installed with a thermally broken frame and careful junction detailing may add very little to the Ψ-value budget; a wall-to-roof junction that is unaddressed can add substantially. Improving glazing while leaving those junctions untouched is a poor trade.
Air leakage changes the ranking again
The fabric calculation — U-values and Ψ-values — does not include infiltration. Uncontrolled air movement through the building envelope carries heat with it, and in leaky buildings this component of heat loss is not marginal. The blower-door test, which pressurises the building to 50 pascals and measures the flow required to hold that pressure, quantifies total air leakage. The UK's older housing stock routinely tests above 10 m³/h·m² at 50 pascals; a Passivhaus-certified building must reach 0.6 air changes per hour or below at 50 pascals — a standard set and verified by the Passivhaus Institut in Darmstadt ↗.
The critical point for the glazing-first instinct is that air infiltration, once measured, often proves to be a larger heat-loss contributor than the windows themselves in a leaky house. The air moves not through the glass — which, unlike the masonry, is at least continuous — but through the gaps described in where the air actually goes: service penetrations, the junction between window frames and reveals, dry lining that is not taped, loft hatches that sit in a warm ceiling without a seal. Replacing glass while leaving those gaps does nothing to the infiltration term.
What the measured evidence shows
The performance gap between designed and measured energy use has been documented across large sample studies. The Leeds Metropolitan University work published in 2014 — examining housing retrofitted under the Warm Front scheme — found that dwellings using more energy than predicted before retrofit achieved smaller-than-predicted savings, while dwellings using less energy achieved larger ones. The pattern points not to a glazing problem but to workmanship, infiltration and the gap between what the model said and what the meter said. In none of the post-occupancy analyses that have reached the literature does glazing specification emerge as the dominant explanatory variable for underperformance.
The CIBSE TM54 methodology for evaluating operational energy performance asks designers to work through dynamic simulation that accounts for infiltration, internal gains and occupancy patterns — because steady-state elemental U-values cannot close the gap between design intent and measured outcome on their own.
The discipline is hierarchical. Rank the heat-loss paths by their product of area, transmittance and hours of exposure before touching any of them. The wall almost always comes first. The roof comes second. Air sealing is entangled with both. The windows, when that honest triage is run, are rarely the problem that the first conversation makes them.
Read next