The order of magnitude
Measure the losses before choosing the interventions, and the ranking almost always surprises.
 PLATE 01
Survey figures before any intervention is chosen. The ranking is the analysis, not a preliminary to it.
The list before the list
A building loses heat through its fabric, its junctions, its air leakage, and — if it is occupied — through the calculated exchange of mechanical ventilation. These four paths are not equal, and they are rarely ranked in the way intuition suggests. The window question dominates most early conversations about building performance; in a poorly insulated house with a leaking loft line, glazing is usually fourth on the list of where the energy is actually going.
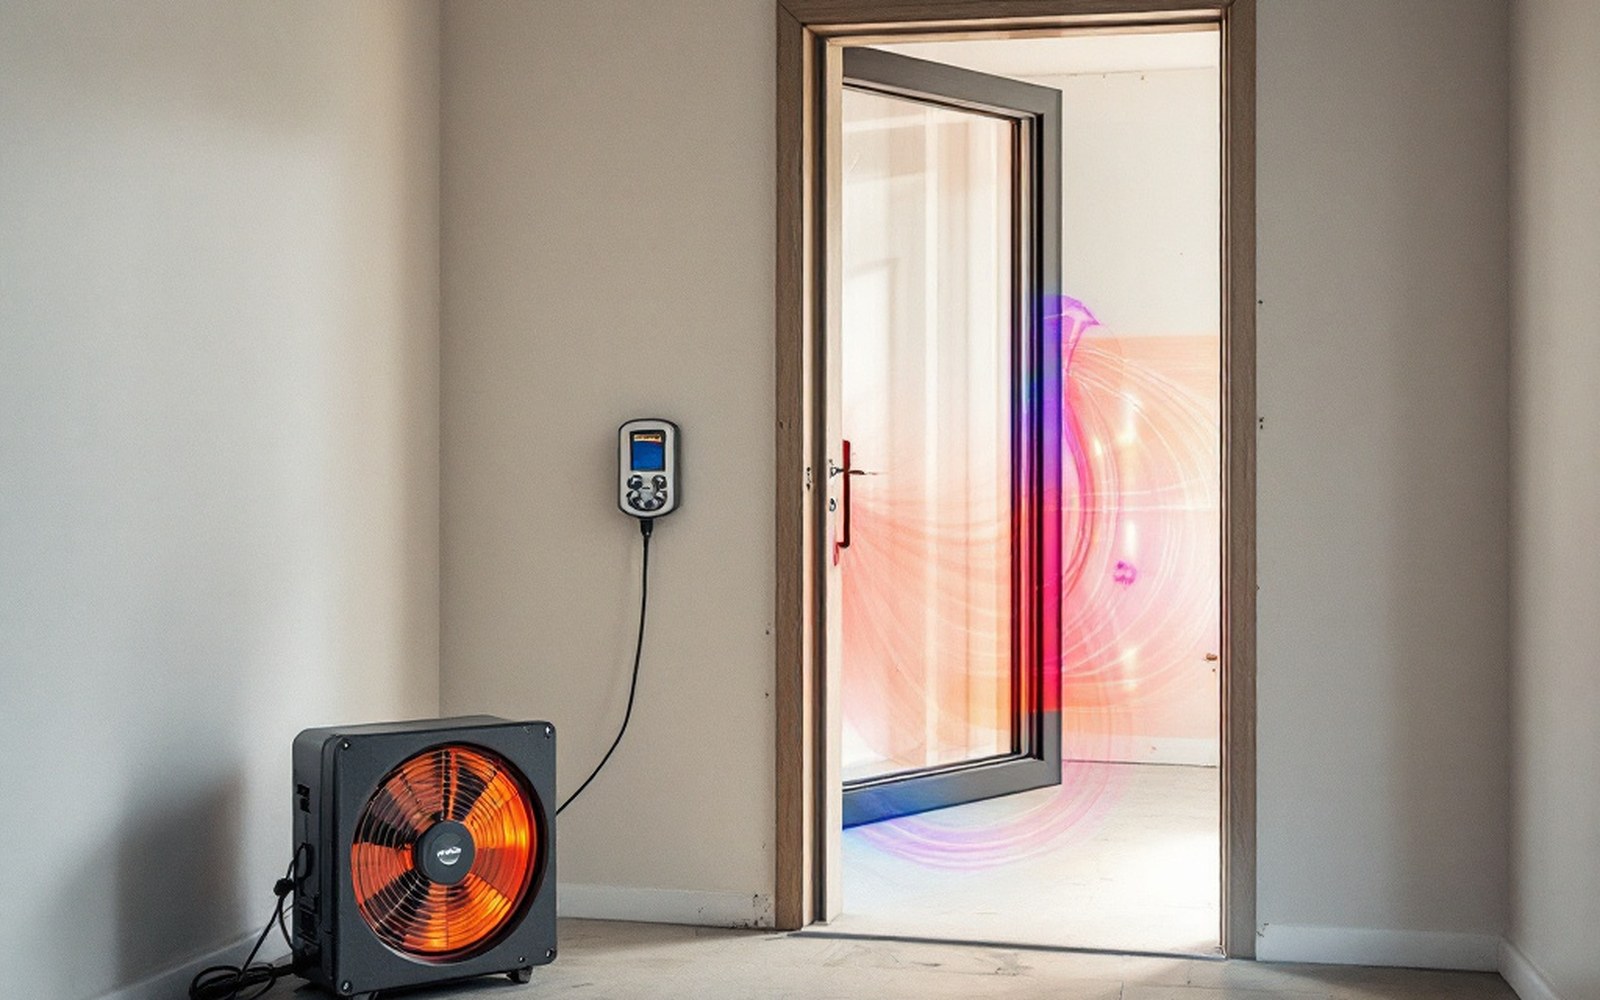 PLATE 02
Fifty pascals is high enough to swamp wind and stack effects and low enough to leave the fabric undisturbed.
The starting discipline is arithmetic. Element areas multiplied by their U-values give fabric heat loss in watts per kelvin. Junction lengths multiplied by their Ψ-values (linear thermal transmittance, in W/m·K) give the bridging penalty on top. Air permeability — measured in cubic metres per hour per square metre of envelope at 50 Pa — converts to a ventilation heat loss term once you have the envelope area and a factor for the difference between test pressure and real operating conditions. Each number lands in the same unit: W/K, watts lost per degree of temperature difference. Add them and you have a heat loss coefficient for the building. Divide by floor area and you can compare it to any other building, or to a design target.

Warmth reaching the outside face of the building: the eaves line, the window heads and the reveals are all brighter than the wall they sit in.
The Passivhaus Institut ↗ sets its space-heating demand limit at 15 kWh per square metre per year, with a maximum specific heat load of 10 W/m² — numbers that only follow from knowing the full disaggregated loss. Without the ranking, meeting either figure is guesswork.
Divide by floor area and you can compare it to any other building, or to a design target.
What the ranking routinely reveals is that air leakage — invisible, untested in most existing stock — often contributes as much heat loss as a poorly insulated wall section, and that thermal bridging at junctions can add twenty to thirty percent to the fabric loss calculated from elemental U-values alone. The windows, meanwhile, are a small area with a large U-value: conspicuous, but not dominant.
The performance gap documented across large monitored samples in the UK ↗ between modelled and measured energy use is, in part, a ranking failure — work carried out in the wrong order, or without the order being established at all. A wall is insulated; the junction detail is unchanged; air leakage is never tested. The individual intervention is real, but its contribution to measured outcome is smaller than expected because the dominant losses were left untouched.
Ranking is not a preliminary. It is the analysis.
Read next